Journey Mapping
- Sep 08, 2015
- By Kalei
- In Design, Internship, Marketing Trends
- 0 Comments
How exactly can a business determine what they need to change about their product/service without knowing how the customers are currently reacting? They can’t. But customer journey maps make that easy. During my internship at Concur, I was introduced to the concept of a journey map used in a business setting— visually represent the customer’s thoughts/feelings/actions throughout their entire interaction with the brand, and the possibilities are endless. You’re able to pick any point in that journey and just point to it— there’s something tangible in front of you to describe the point in the process you just chose to highlight.
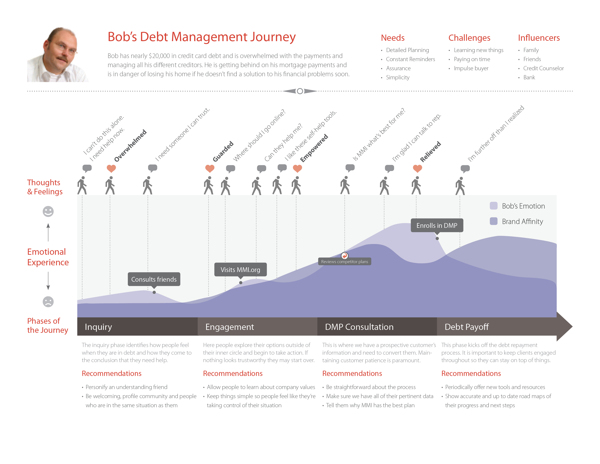
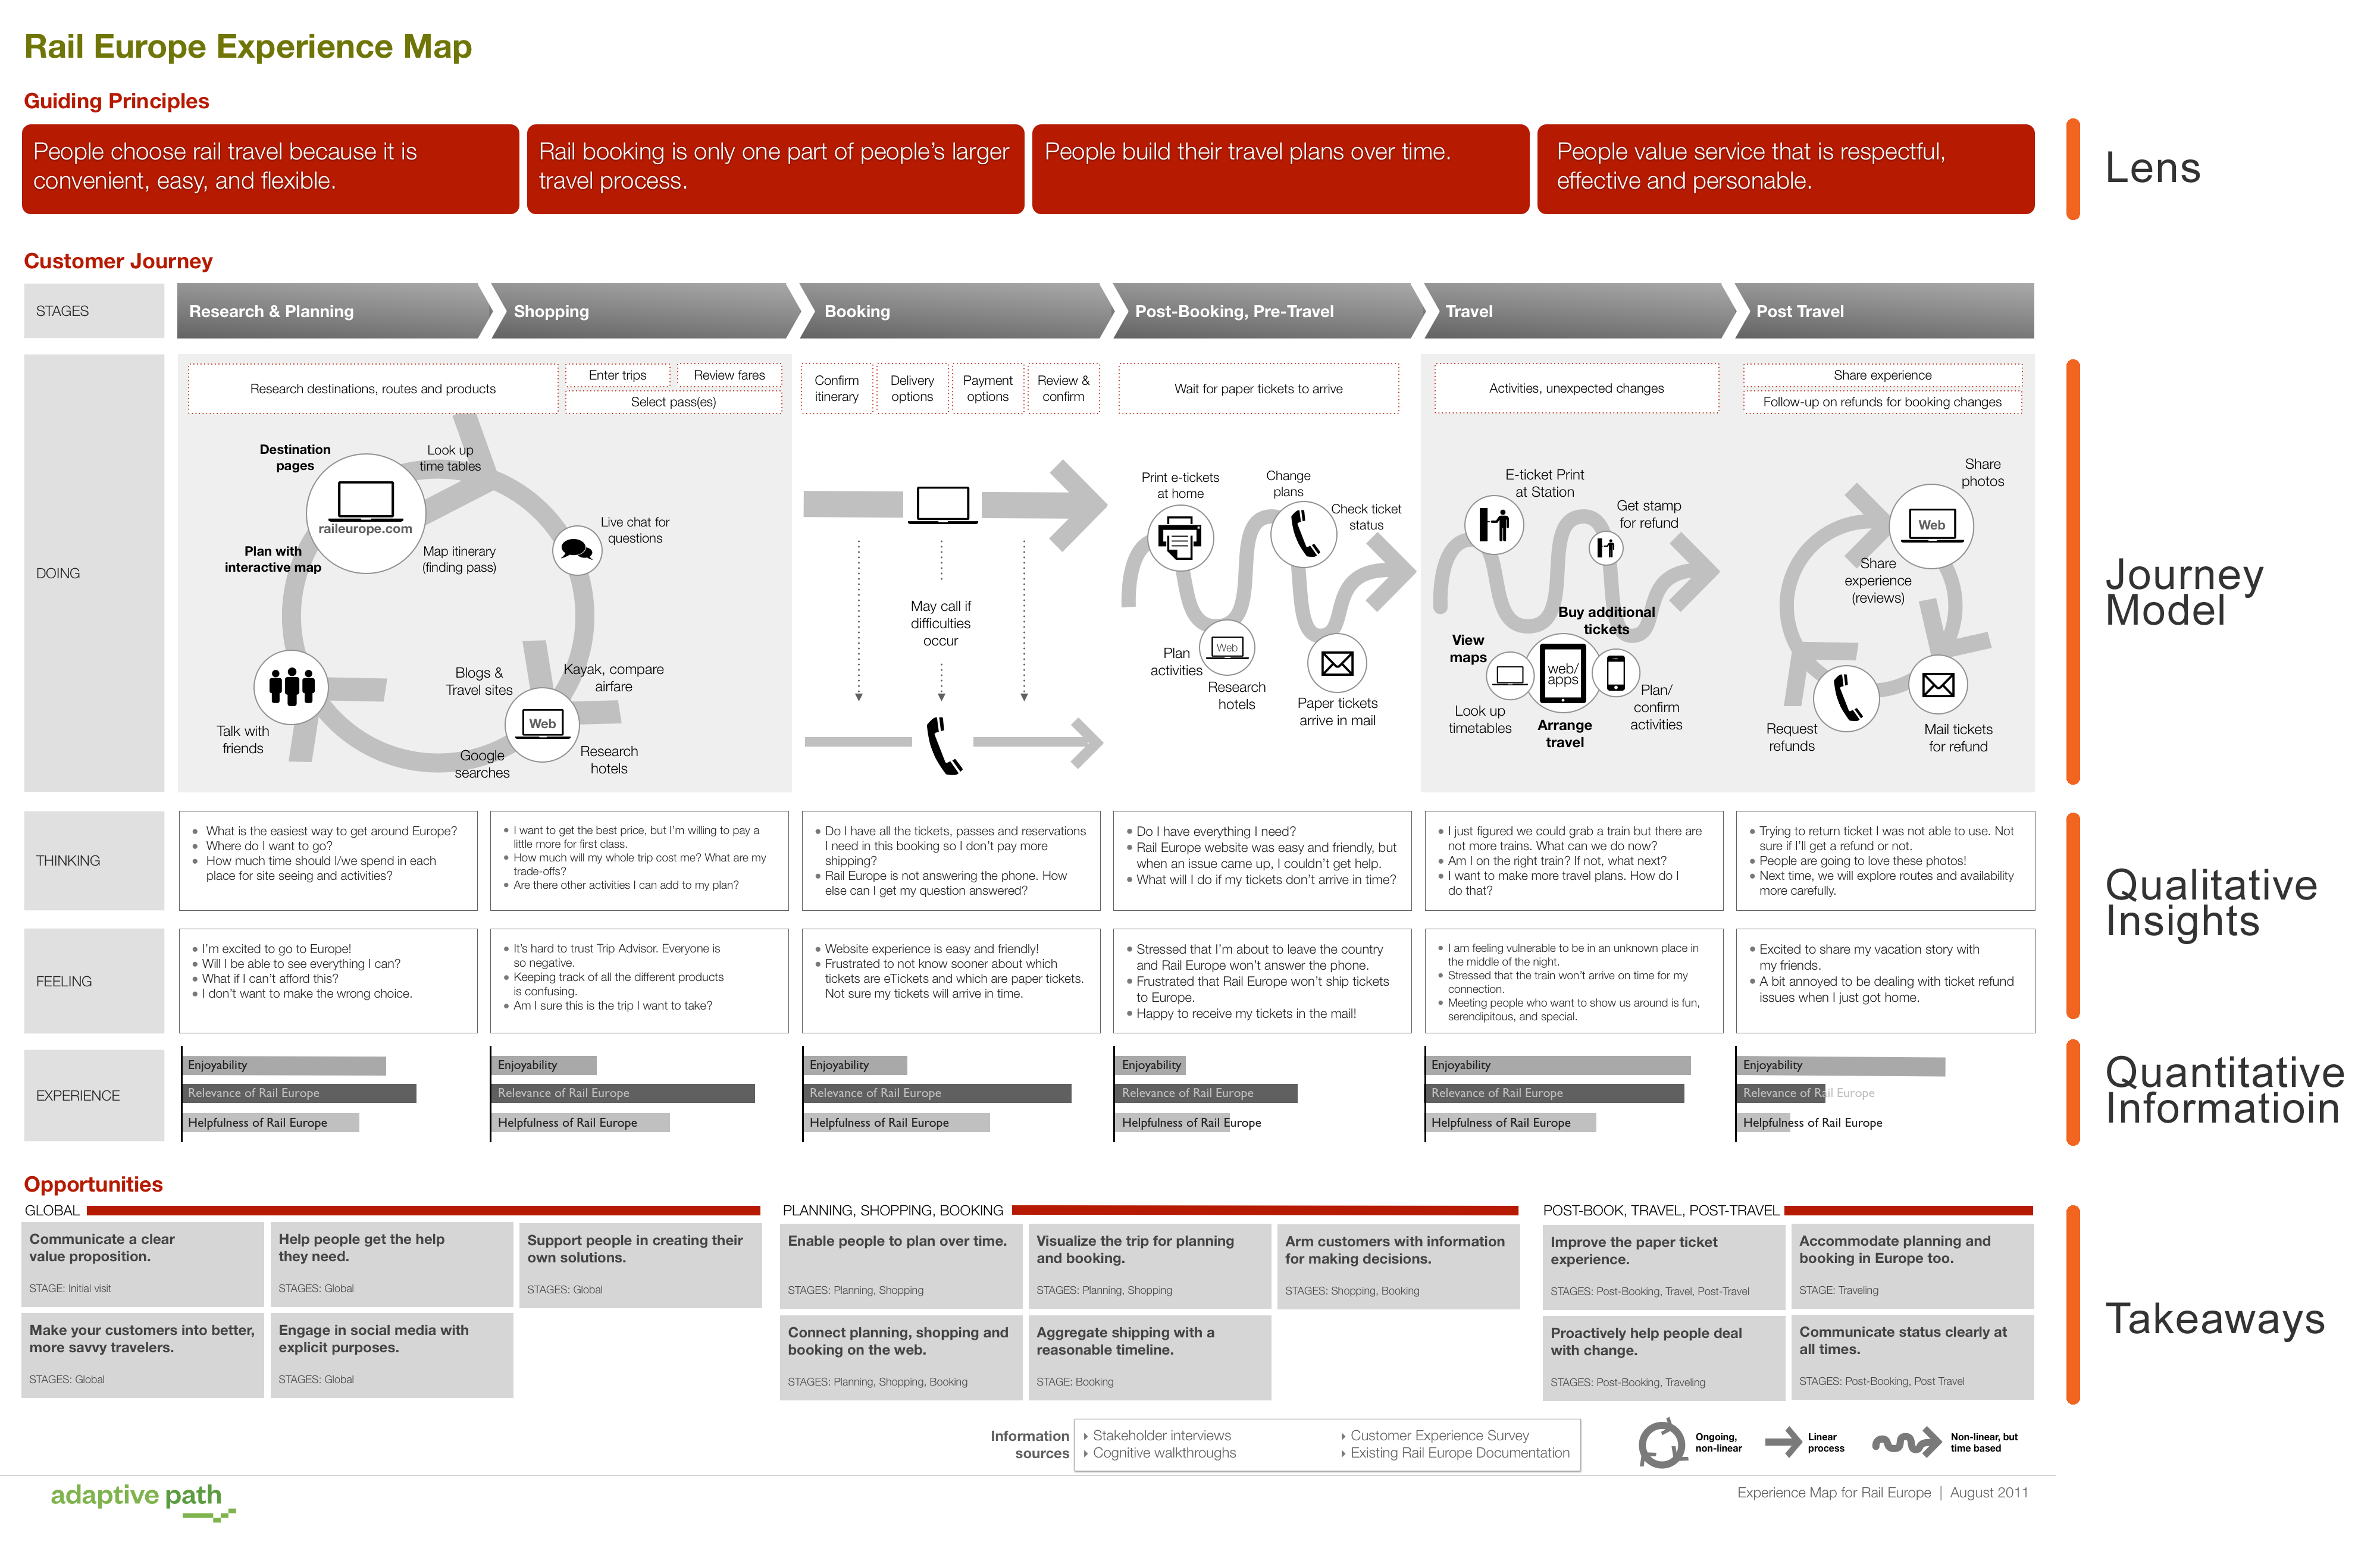
My project for the summer was to take the research my team had done, and design a journey map to do it justice. Take a look at a few of the journey maps I found on Google while beginning my project— it’s good to see how much the design and content vary.


As you can see, there wasn’t a lot of solid footwork for me to begin with. There’s no “right” or “wrong” way to create a journey map, you just have to experiment. This project is something I’ve spent a lot of time on over the course of the past few weeks, so I thought it would be great to show you the process of designing a journey map so you can apply it to your own needs.
First things first, you need to know what content you’re trying to display. Since I was given all the content, I can’t give much insight into all the research and interviews that predated my work, but I know it was a lot. This is a big project requiring a lot of time, but it has a lot of potential when used correctly. Once the content was gathered, I began brainstorming formats of how to lay it out.
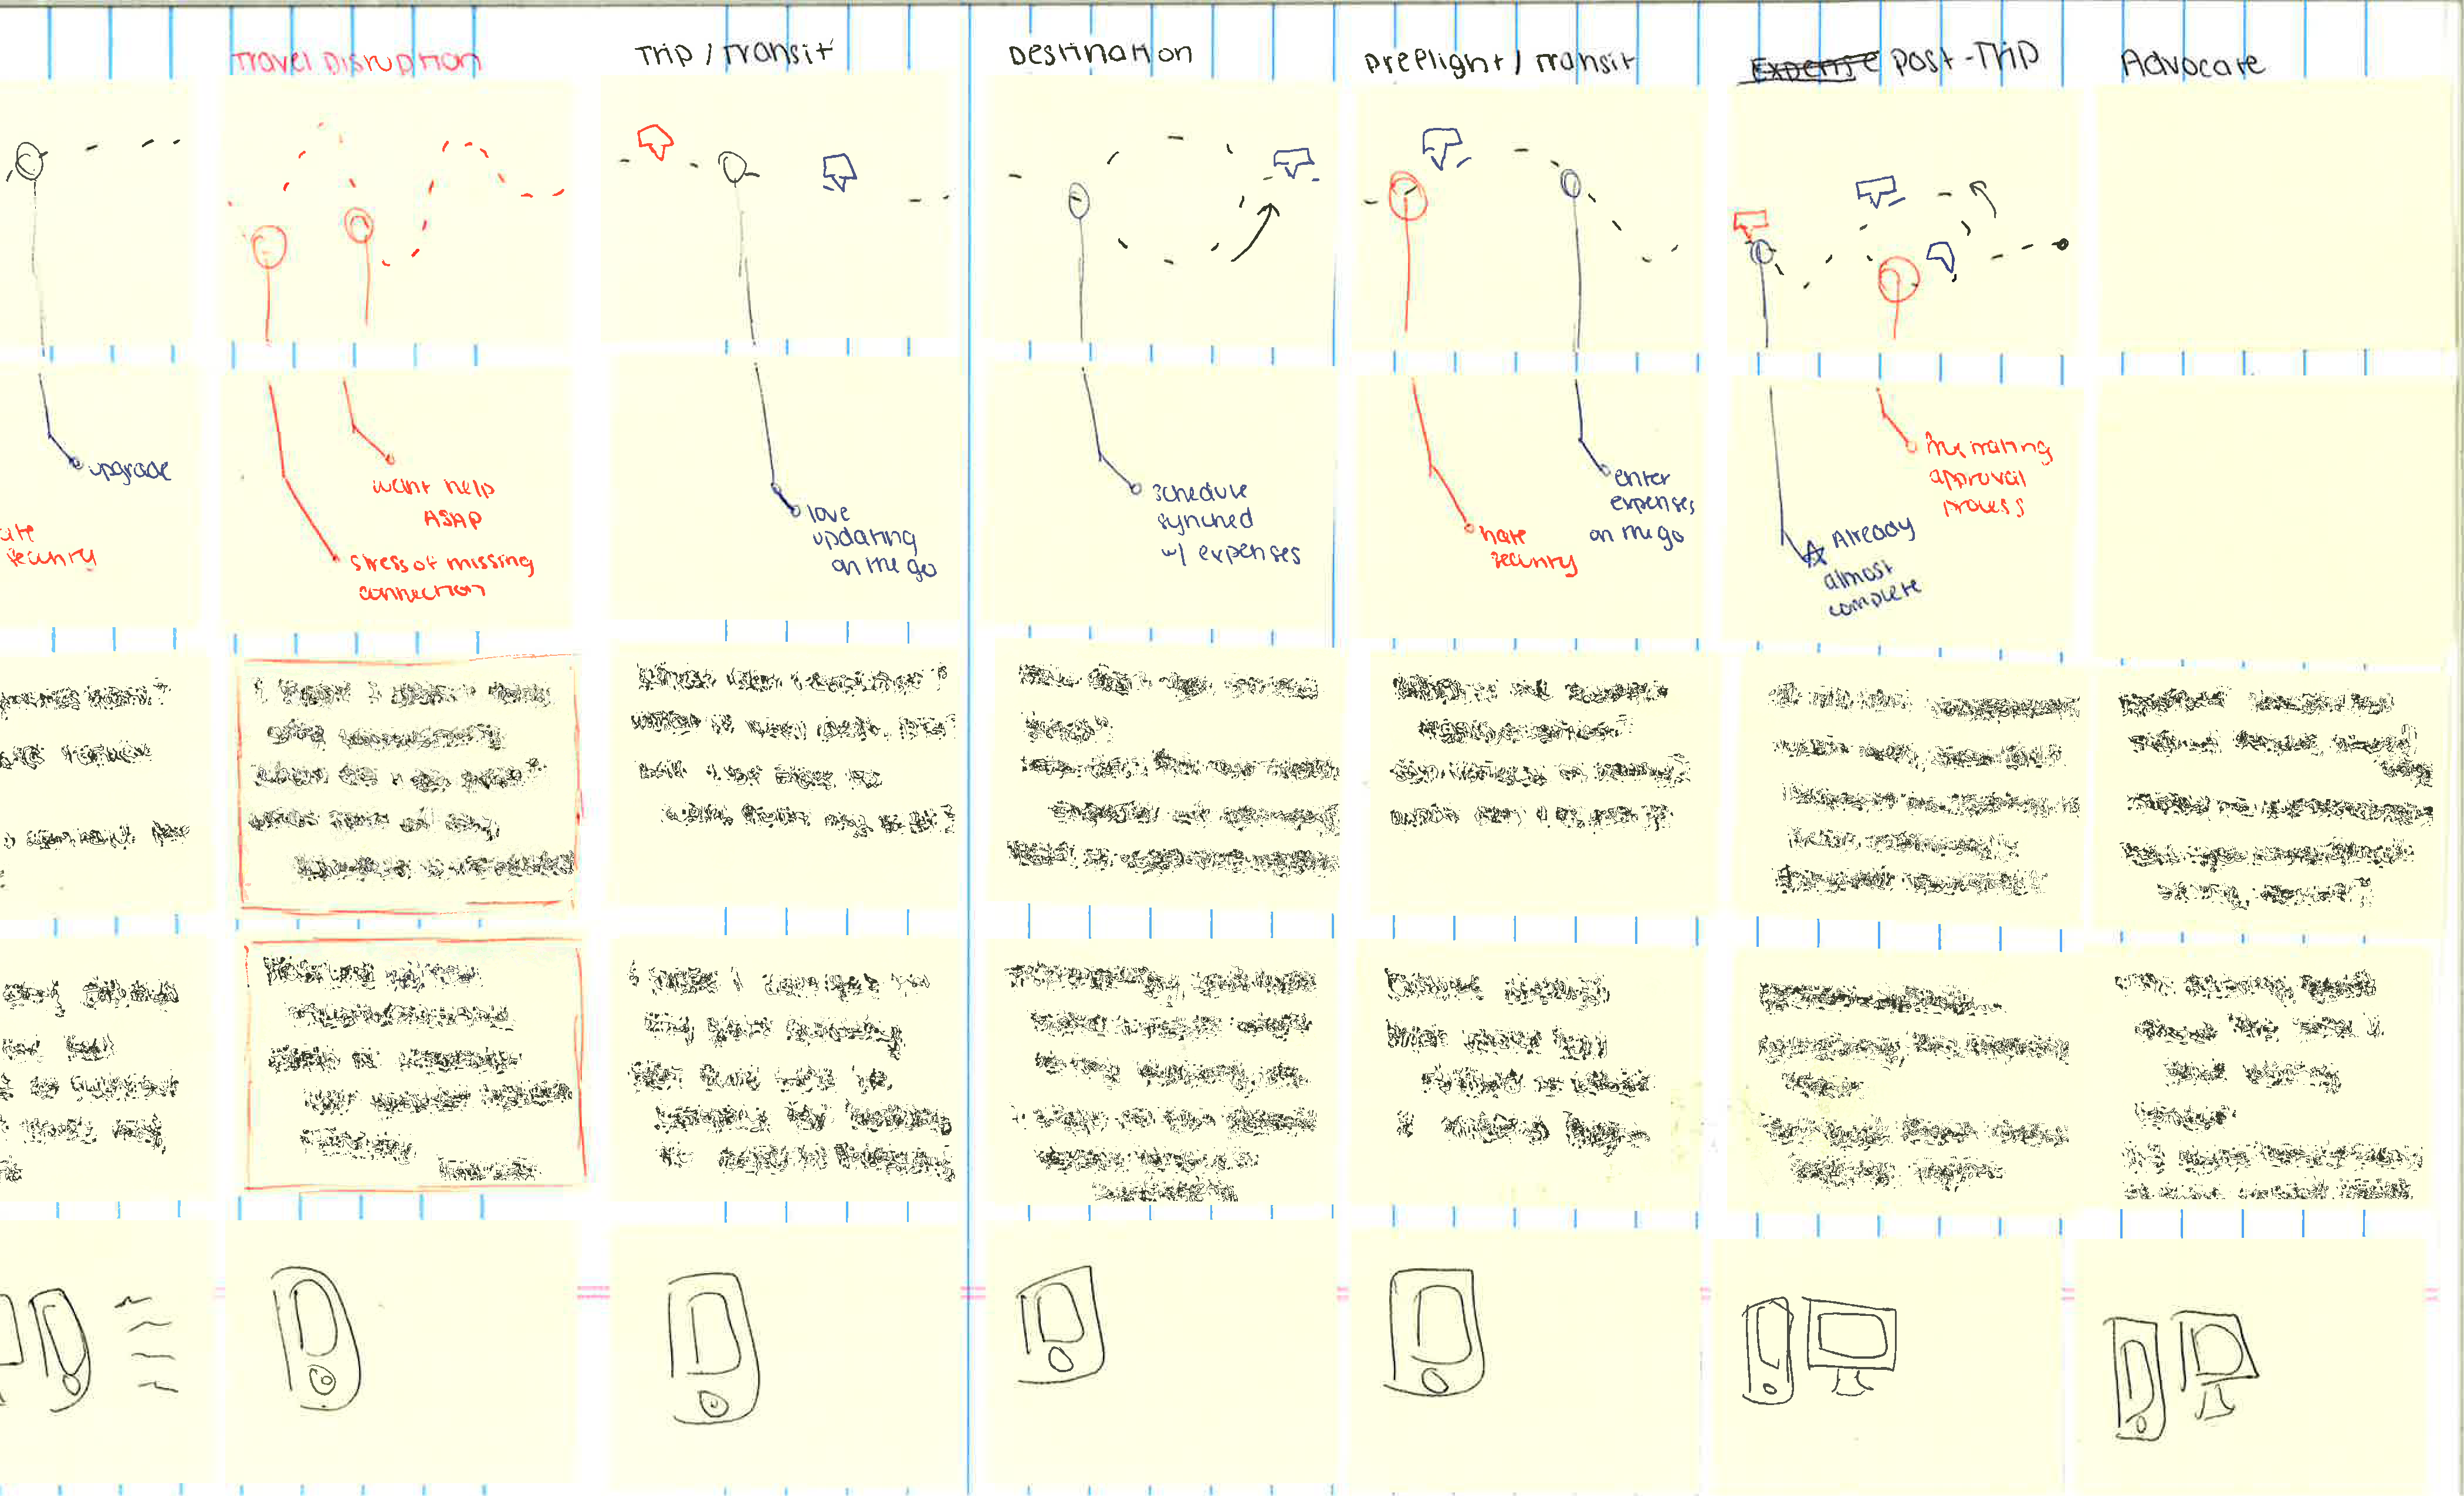
My best advice for this brainstorm session: lots and lots of sticky notes. If you haven’t discovered the brilliance of sticky notes yet, you haven’t tried to plan a big project. I can’t explain how convenient it is to be able to move things around and keep trying new things without having to start over on a blank piece of paper every time you change your mind. Take a look at my sticky note formatting brainstorm:

So you can see how messy things got early on. After the hours of reformatting sticky notes full of content, it’s time to start drawing out the map part. Keep track of the different places along the journey you want to highlight. With our map, we pointed out any intentional choices a customer makes, and the triggers that cause them to take that action. Now you can start to create a visual map with that information.
Next you’ll want to decide on the best program for your needs. For a non-designer, I suggest PowerPoint. This is actually how my project manager delivered the content to me. He created a great PowerPoint version of the journey map, and I did a more finished design using OmniGraffle (which worked fantastically for what we wanted the map to look like). It’s a little harder to pick up than PowerPoint (think Visio, but easier to create a pretty design), but if you have a design background you’ll have no problem using it for a journey map. Here’s the journey map that my manager took his PowerPoint design after:

For those of you using PowerPoint, I recommend reading my articles on designing infographics in Powerpoint (tutorial, tips & tricks). While you aren’t designing an infographic, you’re still reformatting the standard PowerPoint to a very unique format and importing a lot of unconventional information and visuals. The process will be a lot of experimenting, until you end up with something like what you were imagining in that brainstorm phase.
Once you have a basic style in mind, and the content is already all prepped, you just keep building out the map and making adjustments as you go.
OmniGraffle was great because you can create layers to overlay different datasets over the journey map (such as pain points and highlights of the journey, thought bubbles of the customer, etc.). This was a unique way to make it applicable to many different areas of business, the possibilities of layers are endless. Every single department can find a way to use the map this way.
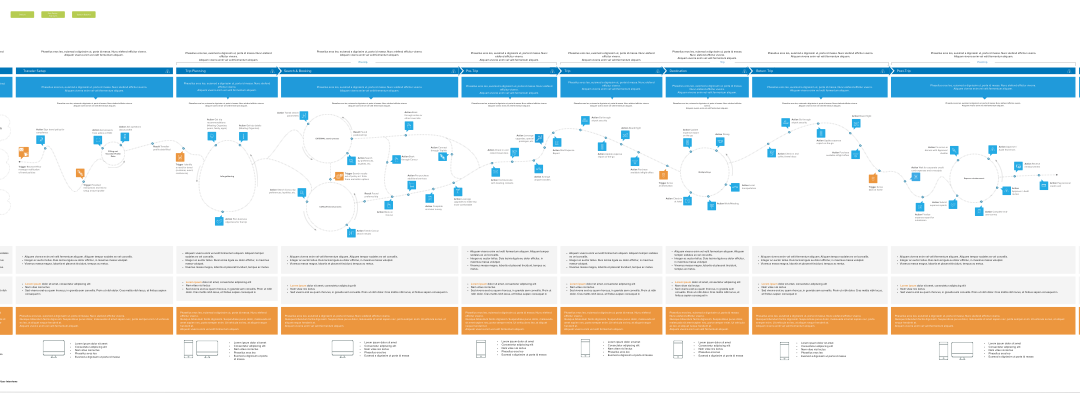
Here’s the final design I came up with on OmniGraffle:

And here are examples of the layers we created for the interactive-nature of the map:


There’s really no way to give specific instructions on such a free-form practice, but this is the same sort of introduction that initially interested me in journey mapping. I hope this inspires you to take a look at how a customer journey map can help your business. I think it was an amazing learning experience for me this summer– everyone who I showed the journey map to was dying for information on how to get it themselves.
Recent Posts
-
 My Final Case Competition – Starbucks & Kombucha
March 23, 2018
 -
 HCDE: Intended and Unintended Consequences of Pokemon GO
March 6, 2018
 -
 Review: “Contagious: Why Things Catch On” by Jonah Berger
February 12, 2018

